RFM Customer Segmentation
Customer Segmentation of AdventureWorks Cycle customer
Click here for Github Repository that contains all the files in this project. Click here for Executive Summary Presentation File for this project.Introduction
RFM analysis is a customer segmentation technique that is used to identify groups of customers based on their purchasing behavior. RFM stands for Recency, Frequency, and Monetary Value. These three metrics are used to evaluate customer behavior and to classify customers into different groups or segments, based on their buying habits and customer value. A brief explanation of each of the RFM components: 1. Recency: How long since the customer last purchase is? (in days) 2. Frequency: How many times the customer made purchase? 3. Monetary: How much the customer spend in total? In this project I will segment the customer of AdventureWorks Cycle with RFM analysis.
The Data
The data used in this project came from AdventureWorks Database :
- AdventureWorks Database - AdventureWorksDB Installation Tutorial
- FactInternetSales Dataset (The data that used here, extracted from the database)- GDrive Dataset Download
Software Used
The Software I used is Jupyter Lab, a notebook to write python code and I used multiple libraries as below:
| Pandas |
|
| Numpy | Working with Numerical Value |
| Matplotlib and Seaborn | Creating Visualization |
Objective
Complete RFM customer segmentation Analysis of AdventureWorks Cycle and Export the Dataset for future analysis.
Chapter 1 - Preparing the Data
Cleaning FactInternetSales Dataset
Data cleaning is important step in Data Analysis, it deals with correcting errors, inconsistencies, and inaccuracies of data , clean data = clean result.
Import the Library
import pandas as pd
pd.set_option("display.max_column", 100)

import numpy as np
import matplotlib.pyplot as plt
import seaborn as sns

# Datetime module
from datetime import datetime, date, timedelta
Import Dataset
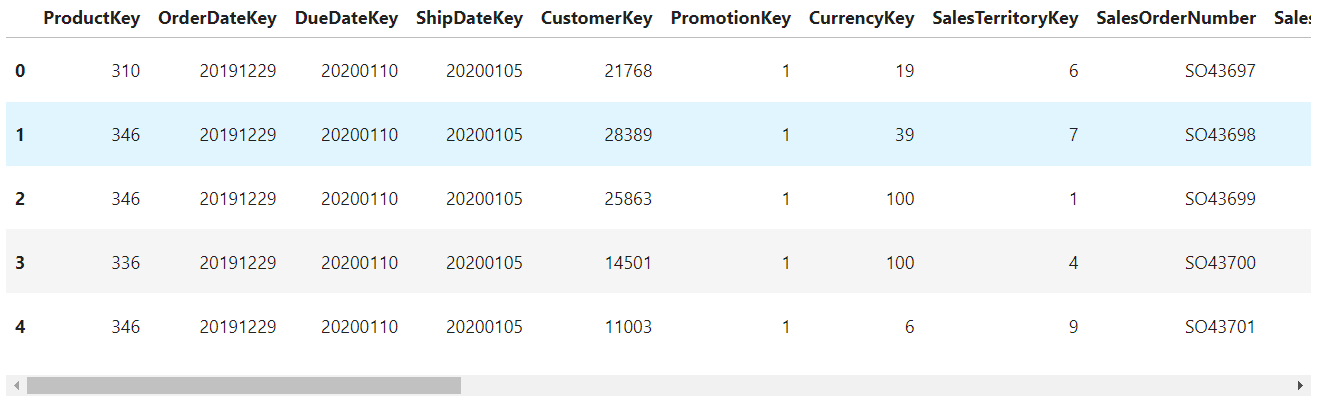
df = pd.read_csv("FactInternetSales.csv")
df.head()
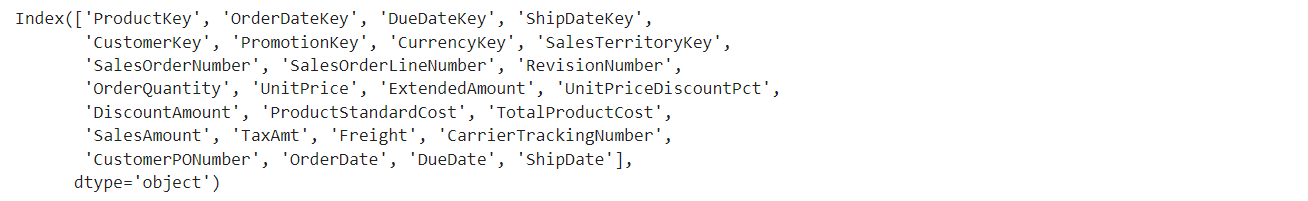
Get the list of columns
df.columns
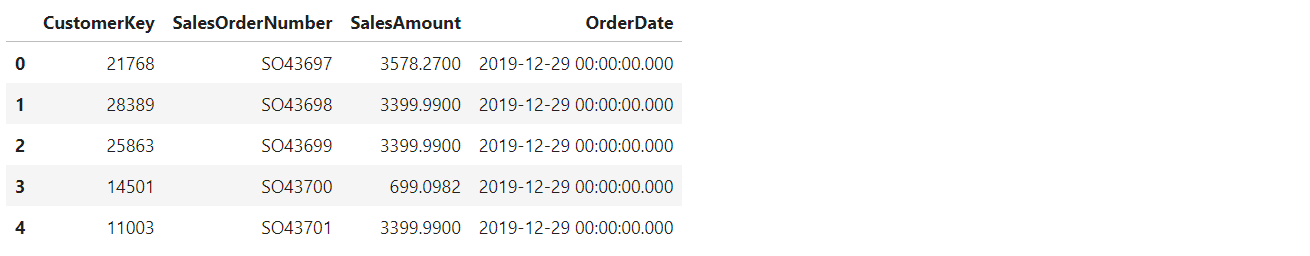
Drop unnecessary columns
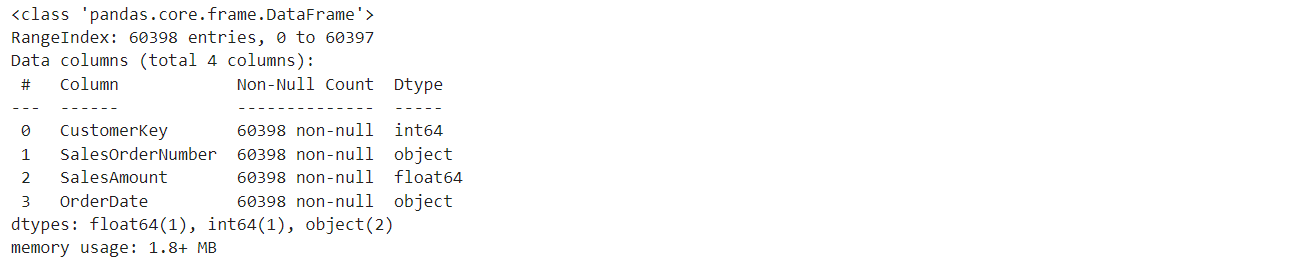
df = df[['CustomerKey','SalesOrderNumber','SalesAmount', 'OrderDate']].copy()
df.head()
Check the data info
df.info()
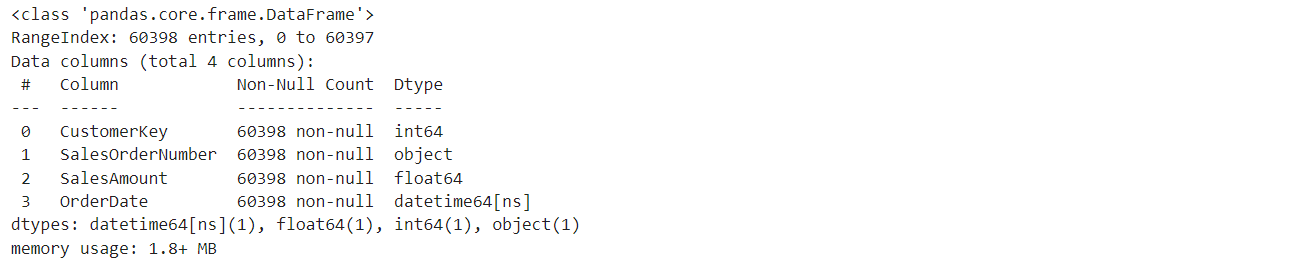
Change OrderDate column dtype to datetime
df['OrderDate'] = pd.to_datetime(df['OrderDate'], format="%Y/%m/%d")
df.info()
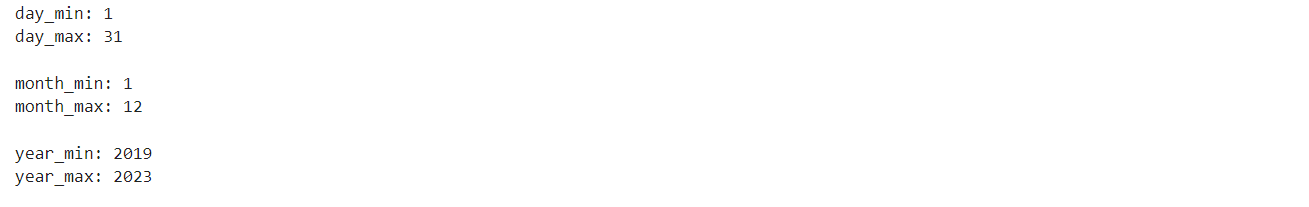
Checking if the OrderDate column data match the format by returning the min and max of day/month/year
# Check the day column
day_date = df['OrderDate'].dt.day
print("day_min: %i" %day_date.min())
print("day_max: %i \n" %day_date.max())

# Check the month column
month_date = df['OrderDate'].dt.month
print("month_min: %i" %month_date.min())
print("month_max: %i \n" %month_date.max())

# Check the month column
year_date = df['OrderDate'].dt.year
print("year_min: %i" %year_date.min())
print("year_max: %i \n" %year_date.max())
Change column name
# the column name is already pretty good, but I prefer use lowercase and use underscore instead of space,
# for me, it's easier to read

df.rename(columns={'CustomerKey':'customer_key','SalesOrderNumber':'sales_order_number',
			'SalesAmount':'sales_amount', 'OrderDate':'order_date'}, inplace = True)
df.head()
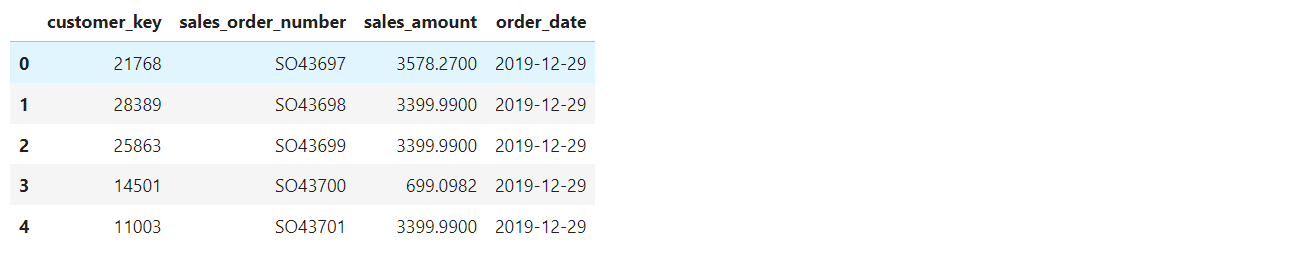
After cleaning the Data we will have a DataFrame that contains the column of:
- customer_key : Customer Key unique ID
- sales_order_number : The order ID, used for calculate Frequency
- sales_amount : The amount of transaction, used for calculate Monetary
- order_date : The date of transaction, used for calculate Recency
Chapter 2 - Creating RFM Table
Groupby
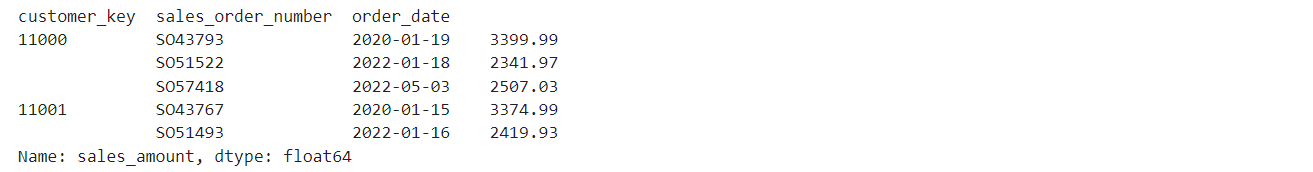
We need to group the rfm by the customer, sales order number, order date to remove duplicates and sum the sales amount
df = df.groupby(['customer_key','sales_order_number','order_date']).sales_amount.sum()
df.head()
Reset Index
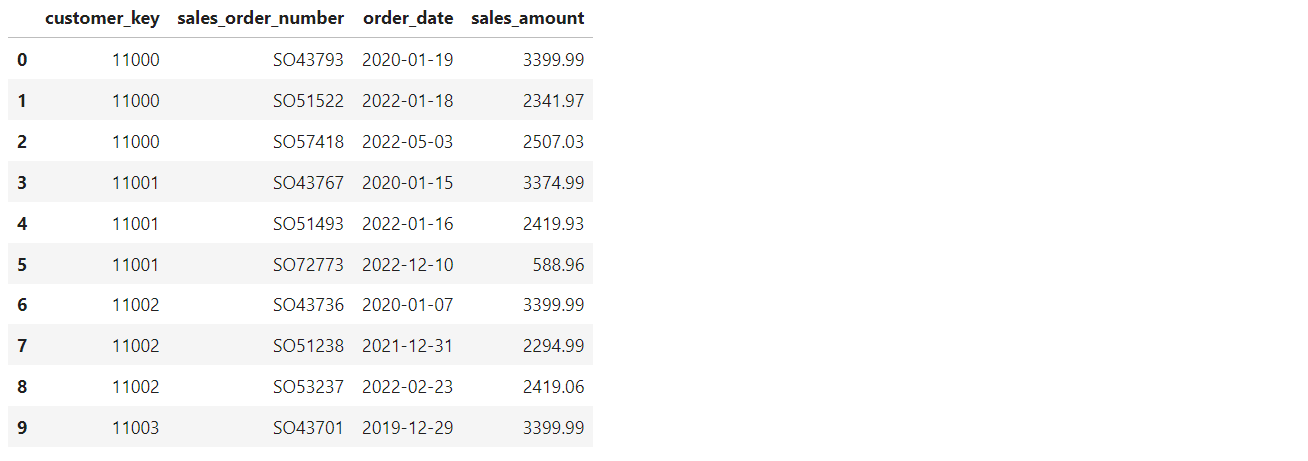
I reset the index to get the DataFrame.
df = df.reset_index()
df.head(10)
Create Recency Table
To get the recency, calculate the latest day in dataset, and add 1 day to it and then subtitute it with the latest day of each customer. I decided to add 1 day to prevent ambigous analysis/calculation in further step example = df.recency.min() = 0 will be 1
daydiff = (df.order_date.max() + timedelta(days=1)) - df.groupby('customer_key').order_date.max()
recency = daydiff.dt.days
recency = recency.reset_index()
recency = pd.DataFrame(recency)

recency = recency.rename(columns={'order_date':'recency'})
recency.head()

Create Frequency Table
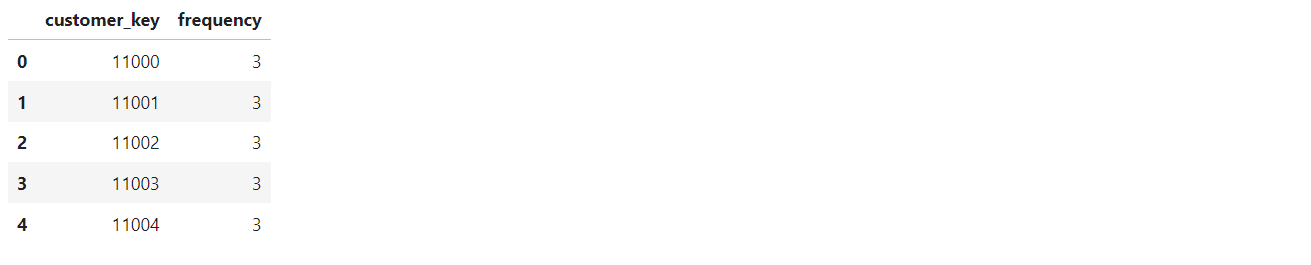
To get the frequency of each customer, group by customer_key column and count the sales_order_number.
freq = df.groupby('customer_key').sales_order_number.count().reset_index()
freq = freq.rename(columns = {'sales_order_number':'frequency'})
freq.head()
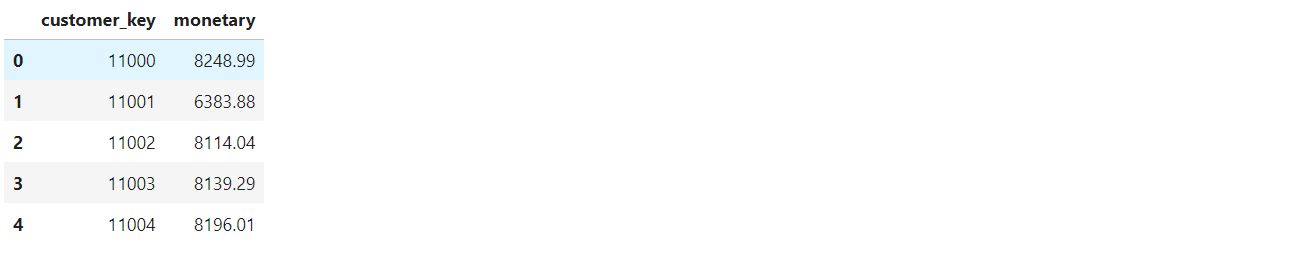
Create Monetary Table
To get the monetary, group by customer_key column and sum the sales_amount.
monetary = df.groupby('customer_key').sales_amount.sum().reset_index()
monetary = monetary.rename(columns = {'sales_amount':'monetary'})
monetary.head()
Merge R, F, and M table
Merge the R, F, and M table to get the full rfm table/dataframe
rfm = pd.merge(recency, freq, on = 'customer_key',how = 'inner')
rfm = pd.merge(rfm, monetary, on = 'customer_key',how = 'inner')
rfm.head()
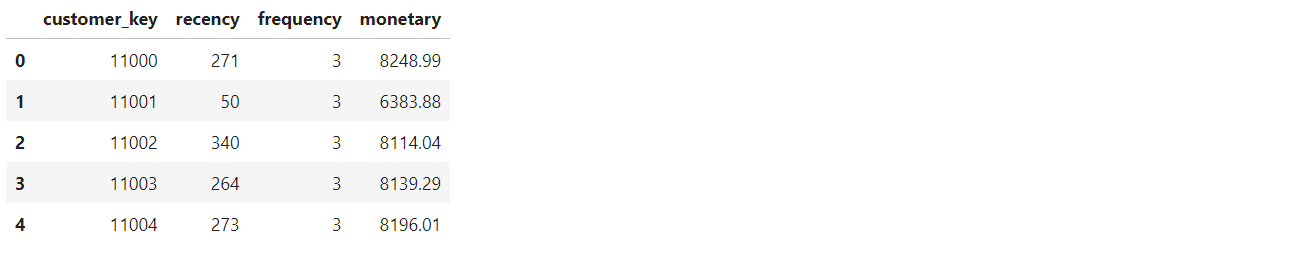
After this step, we will have the rfm dataframe that we can use for segmentation.
Chapter 3 - Calculate RFM Score
Calculate RFM Score
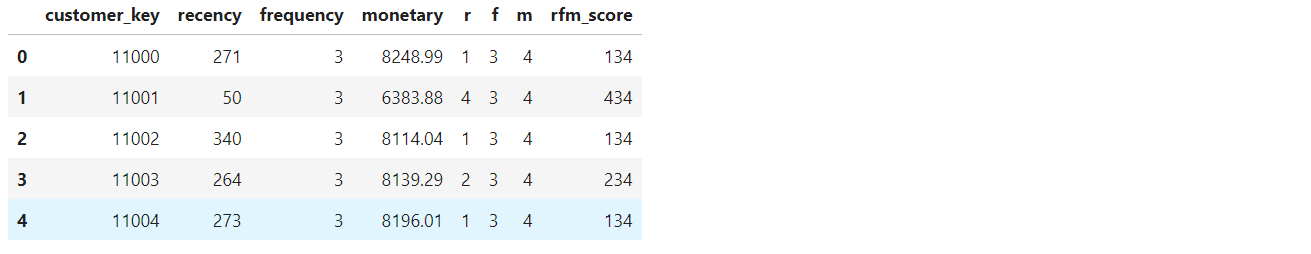
The R and M score will be calculate with quantiles of 4 using pd.qcut so it will be divided into 4 score, lower R will get 4 while higher M will get 4. The Frequency of 1 = 1 score, 2 = 2 score, 3 = 3 score, and > 4 = 4 score.
# R score
rfm["r"] = pd.qcut(rfm["recency"],4,labels=[4,3,2,1])

# F score
f_conditions = [(rfm['frequency'] == 1), (rfm['frequency'] == 2), (rfm['frequency'] == 3), (rfm['frequency'] >= 4)]
f_results = [1,2,3,4]
rfm['f'] = np.select(f_conditions, f_results)

# M score
rfm["m"] = pd.qcut(rfm["monetary"],4,labels=[1,2,3,4])

# RFM Combined Score
rfm["rfm_score"] = rfm["r"].astype(str) +rfm["f"].astype(str) + rfm["m"].astype(str)

rfm.head()
RFM Segmentation
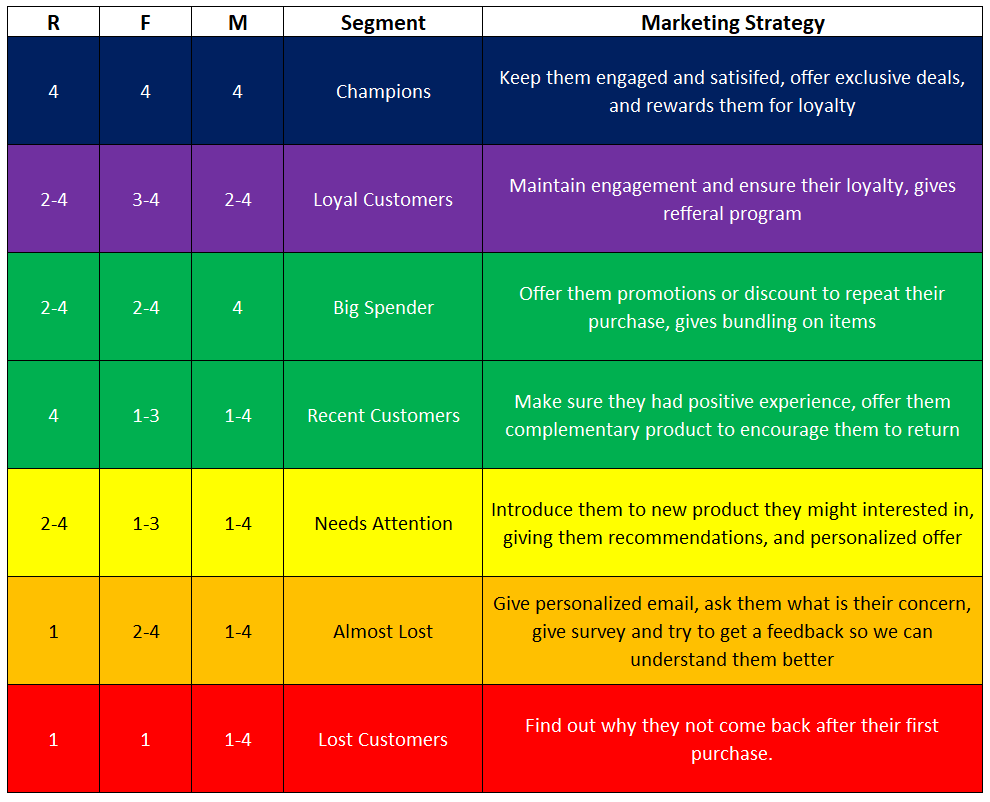
The number of segment is usually determine by the needs or the strategy of the company, I divided into 7 segments and each segment have the score as image below.
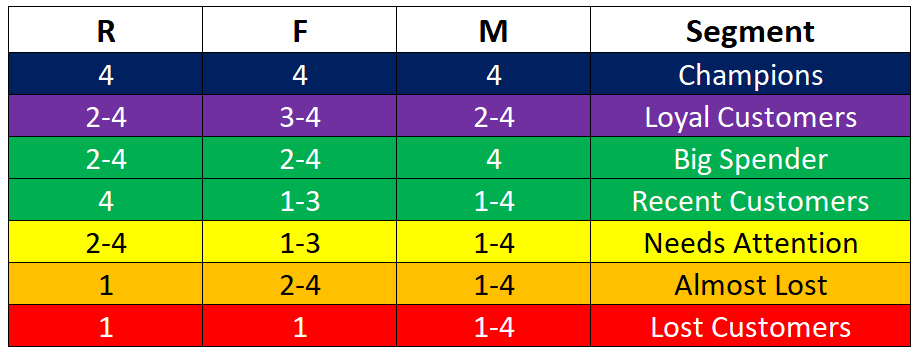
rfm_seg = {
	r'444': "Champions",
	r'[2-4][3-4][2-4]': "Loyal Customers",
	r'[2-4][2-4]4': "Big Spender",
	r'4[1-3][1-4]': "Recent Customers",
	r'[2-4][1-3][1-4]': "Needs Attention",
	r'1[2-4][1-4]': "Almost Lost",
	r'11[1-4]': "Lost Customers"
}

rfm['Segment'] = rfm['r'].astype(str) + rfm['f'].astype(str) + rfm['m'].astype(str)
rfm['Segment'] = rfm['Segment'].replace(rfm_seg, regex=True)
rfm.head()
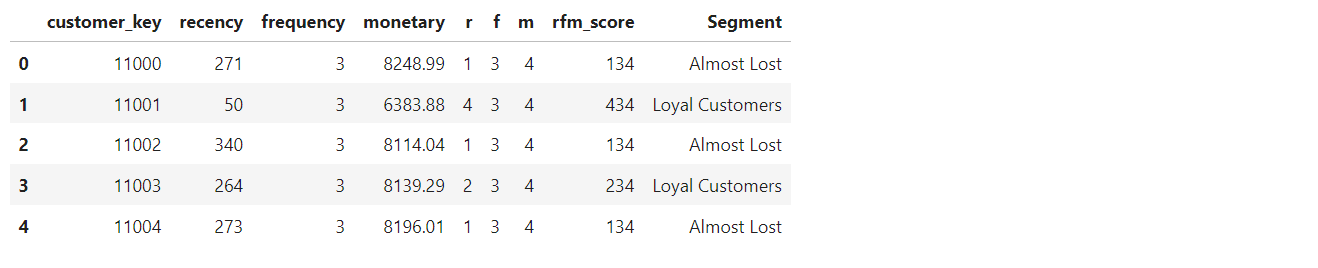
The rfm segmentation is done, after this step we have a dataframe that contains the rfm score and their segment, we can use this for a marketing strategy on what to do with each segment or to do further analysis on the customers.
Chapter 4 - Visualization
Counting each segments
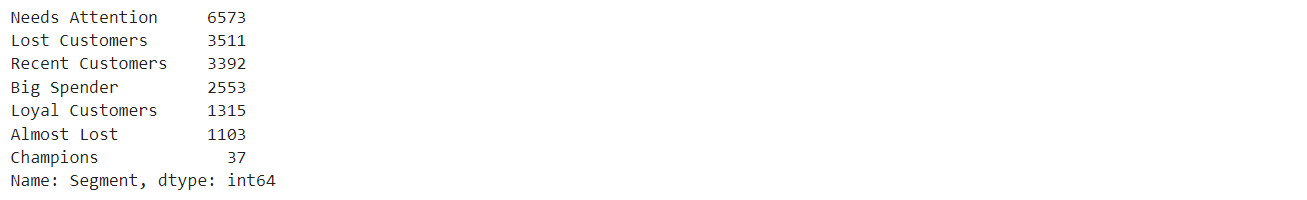
seg_count = rfm.Segment.value_counts()
seg_count
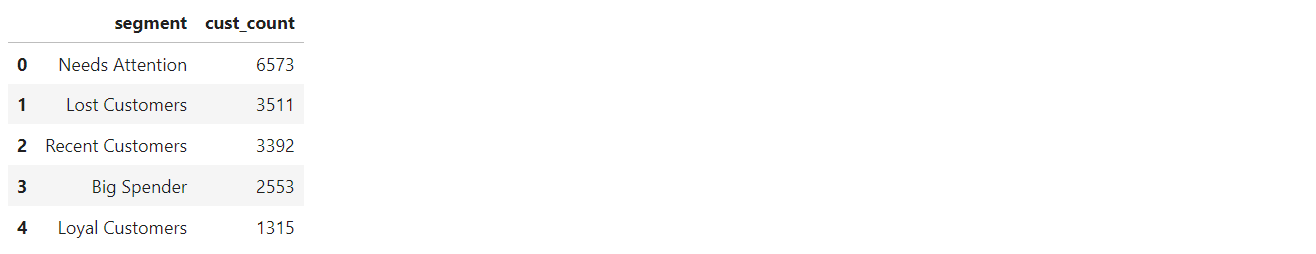
Create dataframe for visualization
seg_count = pd.DataFrame(data = seg_count)
seg_count = seg_count.reset_index()
seg_count = seg_count.rename(columns={'index':'segment','Segment':'cust_count'})
seg_count.head()
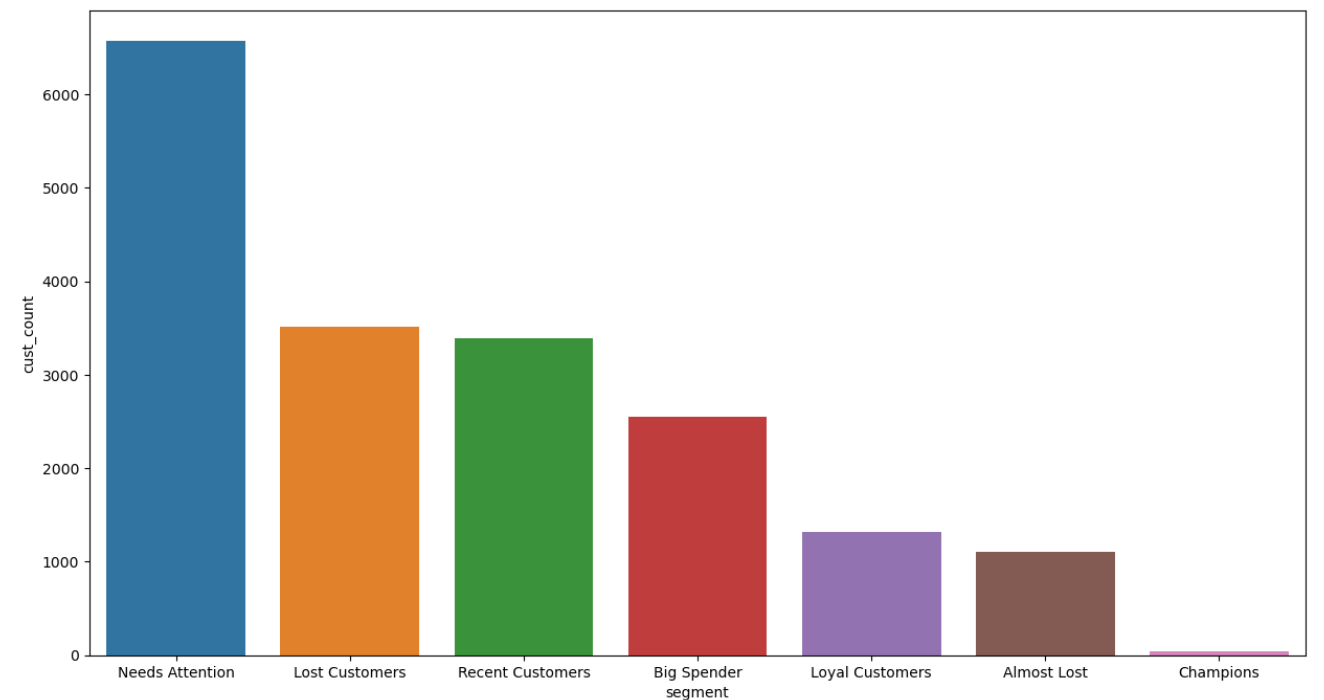
Bar Chart
palette_color = sns.color_palette("tab10")
plt.figure(figsize = (15,8))
sns.barplot(x = seg_count.segment,y = seg_count.cust_count, palette = palette_color)
plt.show()
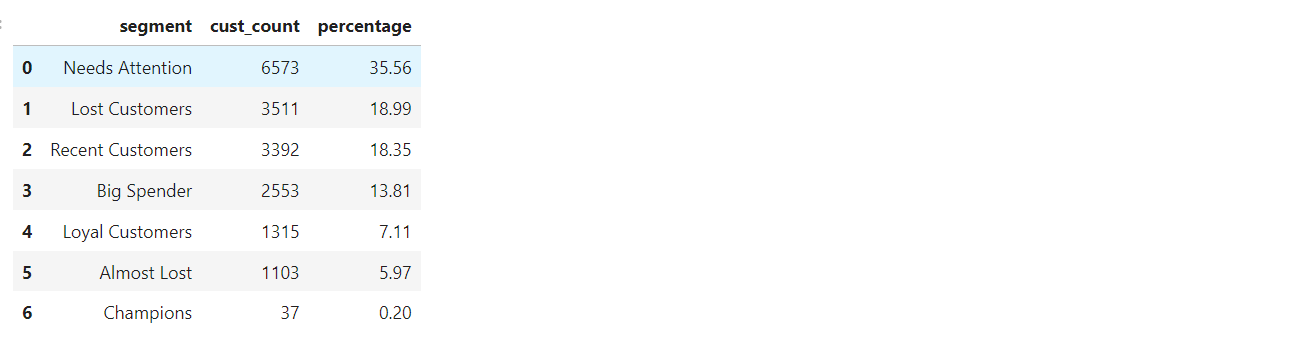
Percentage of each segment
To get the percentage, simply divide cust_count with 18484(Total Customer) and multiply by 100.
percentage_dec = seg_count.cust_count / 18484
seg_percentage = round(percentage_dec, 4)
seg_count['percentage'] = seg_percentage * 100
seg_count
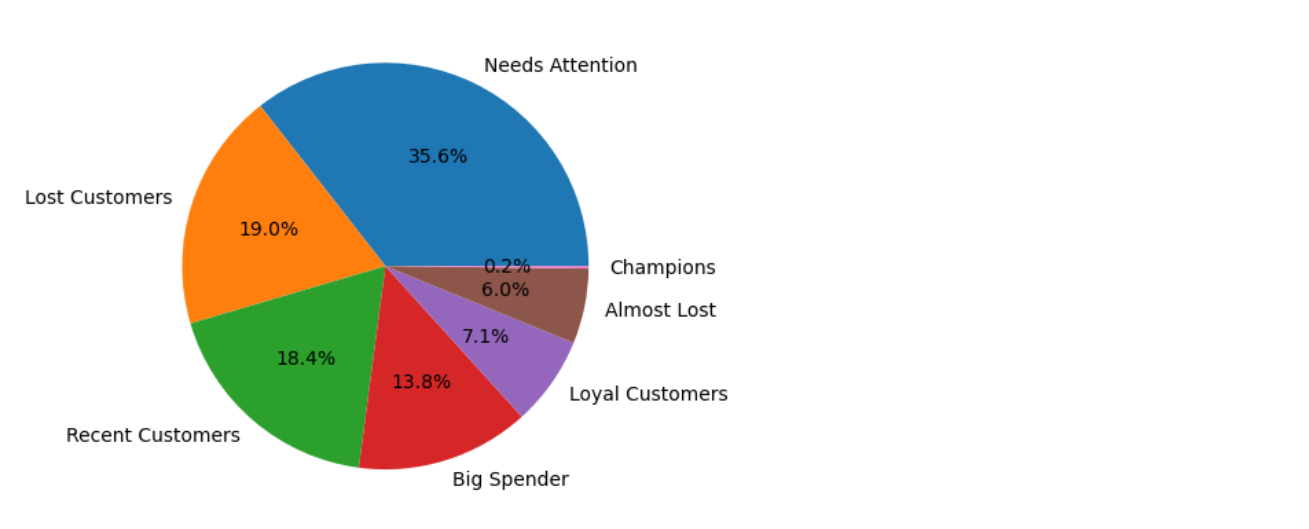
Pie Chart
palette_color = sns.color_palette("tab10")
plt.pie(seg_count.cust_count, labels = seg_count.segment, colors = palette_color, autopct='%1.1f%%')
plt.show()
Export dataframe for further analysis
rfm.to_csv("rfm_segmented.csv", index = False)
Conclusion
After finishing this segmentation I came to conclusion that RFM Segmentation is a tool that can help business to gain deeper understanding of their customers. By analyzing three key factors - Recency, Frequency, and Monetary - RFM allows companies to divide their customers into different segments, each with their own distinct characteristics and needs.
From this segmentation there are several points and insights we can take.
- "Lost Customers" is second highest segment with 19%. Customer in this segment have very low Recency and Frequency, it means the customers in This segment more likely to be churn or lost.
- "Needs Attention" occupies 35.6% of the customers, it's the highest segment. Although it's completely normal to have many medium to low RFM score customer, because they are basically regular customer, but it's better to knock those number down to have more reliable customer.
- It will be interesting to analyze more on what is the characteristics of the customers of each segment, maybe they came from certain area, or specific age groups, or countries, etc.
After this, usually we can apply different strategy for each segment, here are what I think they should do with their marketing strategy with different segment.
With more information such as favorite product/category of each segments, where do they live, day of transactions, etc. we could definitely be more precise and specific with the strategy.