
World Cup 2022 Players Overall Rating
An analysis on World Cup 2022 Players Rating
Click here for Github Repository that contains all the files in this projectIntroduction
This is my first Data Analysis project. The story behind this is when the world cup 2022 is about to start, and I am curious about the national team that has the highest rating in FIFA 23 game, and also this is the first month of my journey in learning Data Analysis, so I think to myself "Why not I make this into project?" because I also heard someone said it if you're confused on where to start your Data project, find & work on project that related to your passion, and I love football, therefore I make this into data project.
The Data
The data used in this project came from multiple sources, that includes :
- FIFA 23 Players Dataset - Kaggle
- Players that is in the WC squad list - Wikipedia
- Players data that doesnt get included in FIFA 23 game - Fifaratings
Software Used
| Jupyter Notebook |
|
| Microsoft Excel | Data Wrangling |
| Tableau | Creating Visualization and Dashboard |
Objective
The objective of this project is to:
- Find Overall rating of every country in World Cup
- Create a visualization that can show all country overall rating
- Create a visualization that can show all country average age
- Find Country with the highest and the lowest Overall Rating
- Find Country with the highest DF, MF, and FW overall rating
Chapter 1 - Preparing the Data
Cleaning FIFA 23 Dataset
First thing to do, we're going to clean the FIFA 23 Dataset from Kaggle with python in Jupyter Notebook. The purpose of this is to get the data that we wanted only, and adjust the formatting of some columns to the desired one.
Import the Library
import pandas as pd

pd.options.mode.chained_assignment = None
Load the Data
fifa23players = pd.read_csv('Fifa 23 Players Data.csv', low_memory=False)
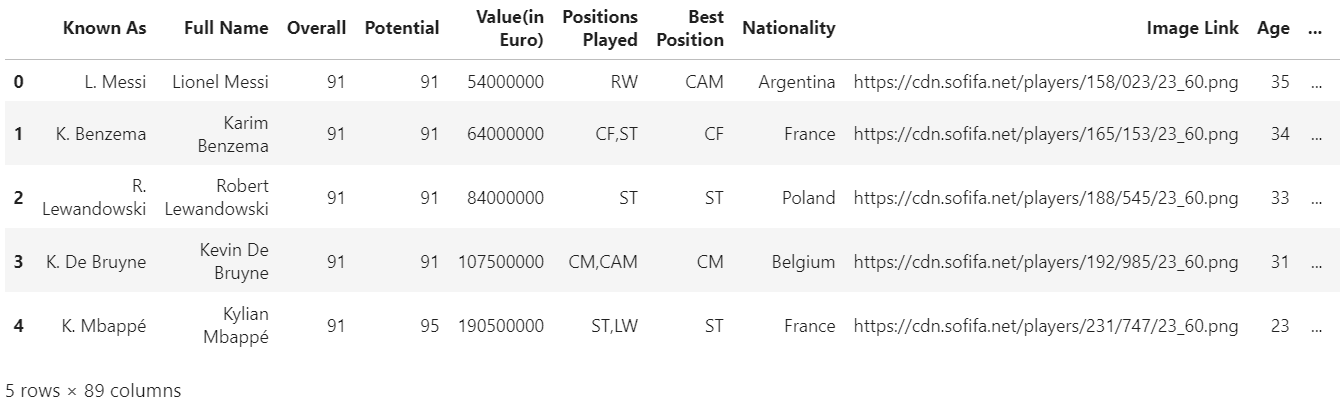
fifa23players.head()
This is how the raw dataset looks like, it has 89 columns, which is quite a lot.
Shows all the columns
View all the columns in this dataset.
fifa23players.columns
Choose the columns needed
We need to drop/remove all unused columns, for it to be easier to work with and also to make it run faster.
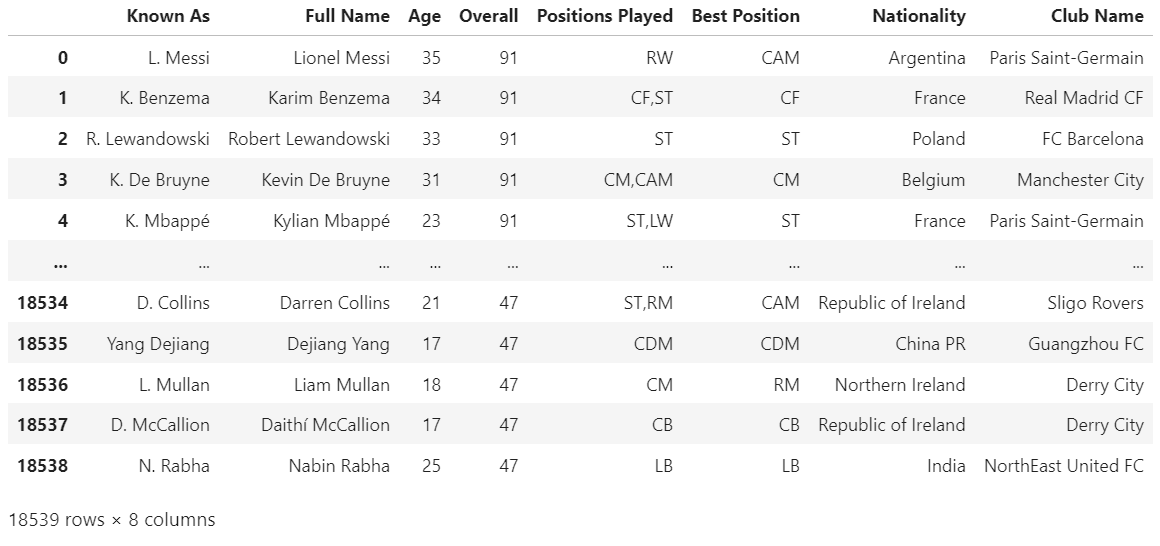
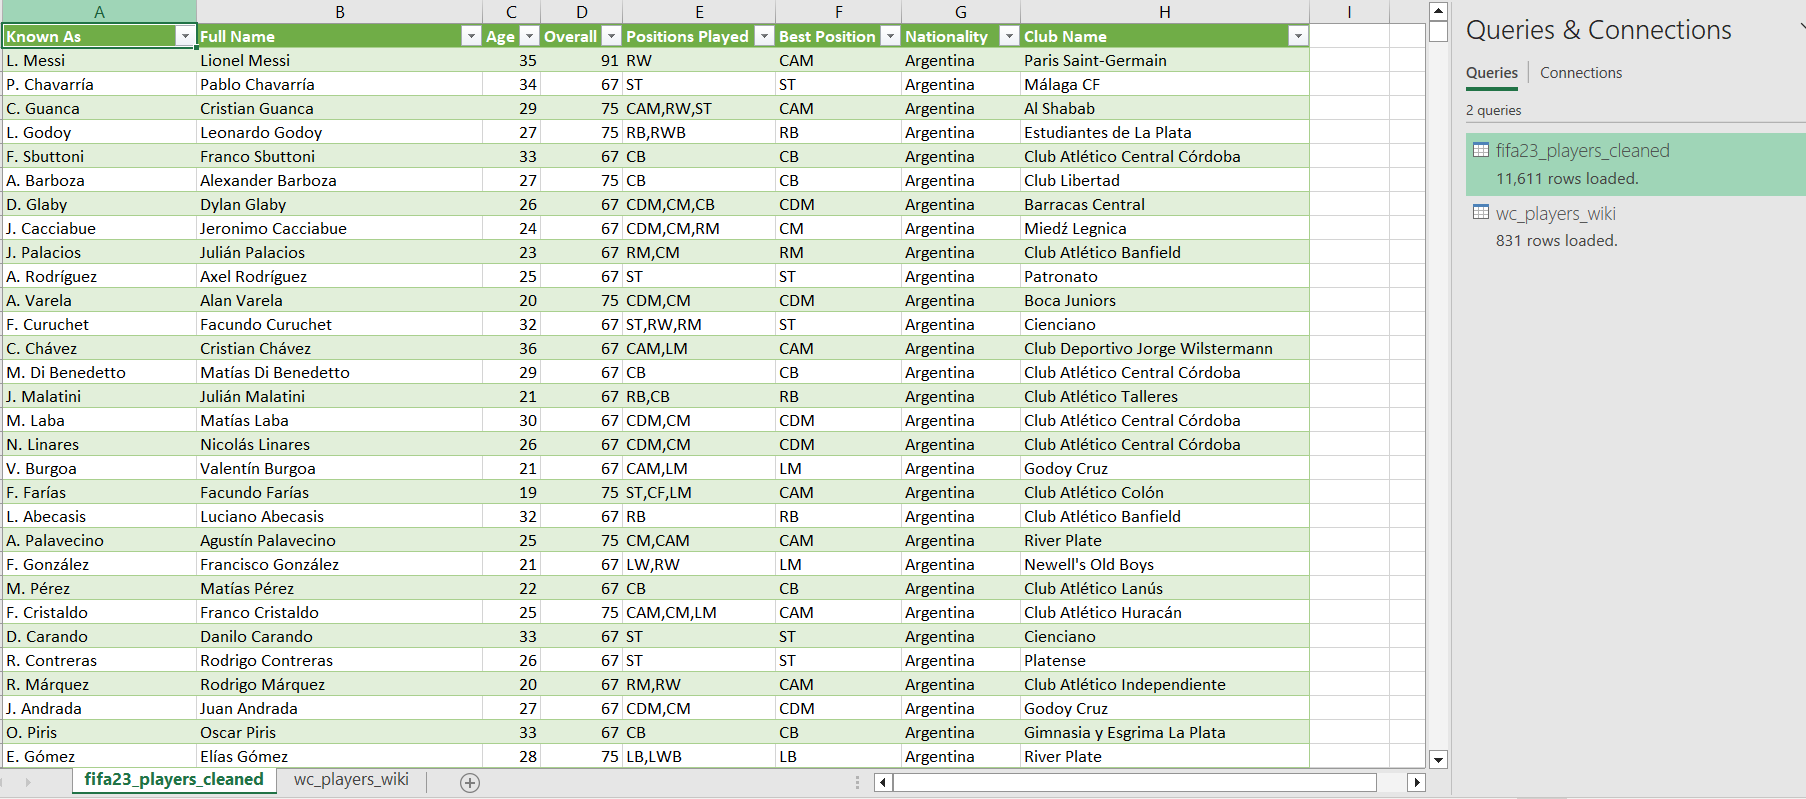
columns_needed = [
	'Known As',
	'Full Name',
	'Age',
	'Overall',
	'Positions Played',
	'Best Position',
	'Nationality',
	'Club Name'
]
df = pd.DataFrame(fifa23players, columns = columns_needed)
df
Dropping Null Values
Drop the rows that doesn't have any data.
df.dropna(inplace=True)
Filter National Teams that participate in the world cup
teams_worldcup = [
	'Qatar', 'Brazil', 'Belgium', 'France', 'Argentina', 'England', 'Spain', 'Portugal',
	'Mexico', 'Netherlands', 'Denmark', 'Germany', 'Uruguay', 'Switzerland', 'United States', 'Croatia',
	'Senegal', 'Iran', 'Japan', 'Morocco', 'Serbia', 'Poland', 'Korea Republic', 'Tunisia',
	'Cameroon', 'Canada', 'Ecuador', 'Saudi Arabia', 'Ghana', 'Wales', 'Costa Rica', 'Australia'
]

df = df[df['Nationality'].isin(teams_worldcup)]
df
Count the values in Nationality
We need to have 32 unique values in nationality, because there are 32 countries in world cup.
from collections import Counter

counter_object = Counter(df['Nationality'].unique())
keys = counter_object.keys()
num_values = len(keys)
num_values

Sort by Nationality
Sort the data for it to be more organized.
df.sort_values(by=['Nationality'], ascending=True, inplace=True)
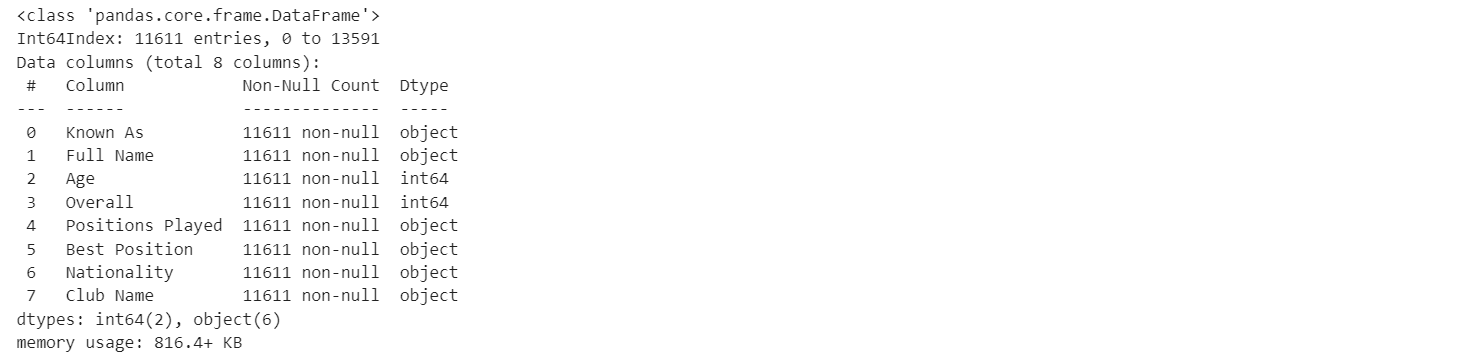
Dataframe Info before export
This is the dataframe info before export, 8columns, 11611 rows no null.
df.info()
Export the cleaned dataframe to .csv
Export the dataframe to get the .csv file.
df.to_csv('fifa23_players_cleaned.csv', index = False)
After this we will have fifa23_players_cleaned.csv file.
Scraping Wikipedia Page
Website Scraping is a process of extraction of data from the website page. Here we're going to scrape the Wiki page to get the list of players that played in World Cup. The web scraping is done with python in Jupyter Notebook.
Import the Library and return the status code of the website
import pandas as pd
import requests

pd.options.mode.chained_assignment = None  # default='warn'
wikiurl = "https://en.wikipedia.org/wiki/2022_FIFA_World_Cup_squads"
Make request to the website and return the status code, Status code 200 = it's allowed to scrape. This is quite important, because in some website it's illegal to scrape it.
response = requests.get(wikiurl)
print(response.status_code)

Create a variable that has all the tables from the website
This is basically the scraping process. We need to store all the scraped data into variables, the variable called tables. If we do "print(tables)" the output will show all the tables available in that page including the ones that we don't need. As we can see, the tables we need is the first 32 tables.
tables = pd.read_html(wikiurl)
If we do "print(tables)" the output will show all the tables available in that page including the ones that we don't need.
Concate all the tables
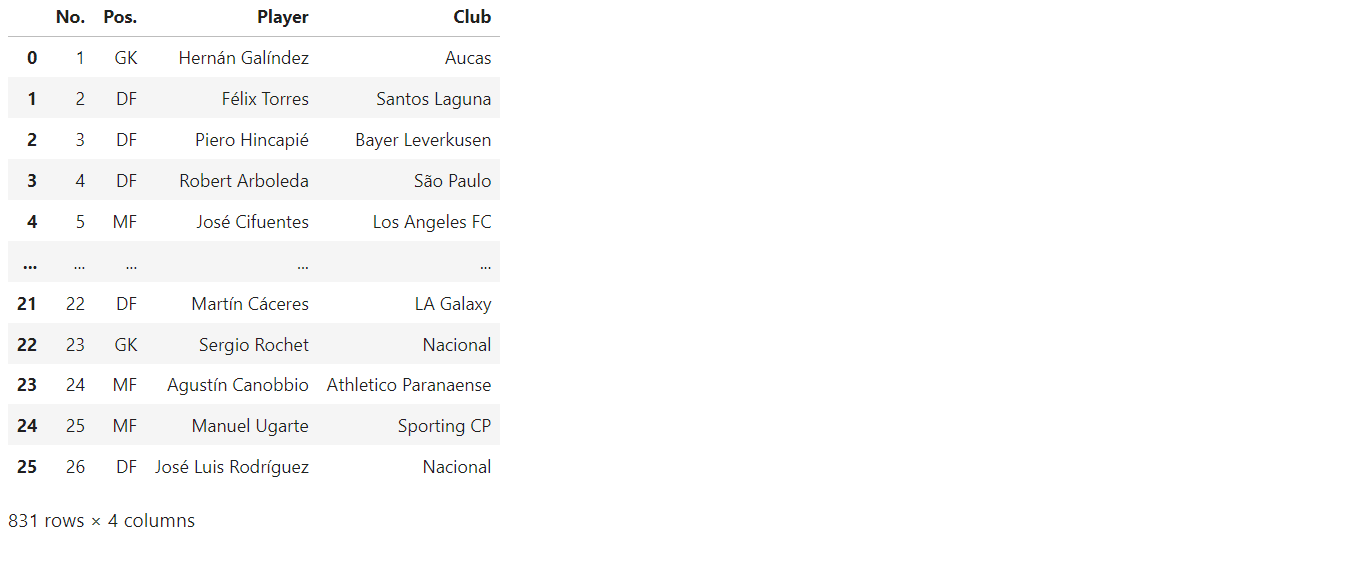
We're going to concate/merge the tables we need. Concate the first 32 tables we need.
tables_concat = pd.concat(tables[:32])
df = tables_concat[['No.', 'Pos.', 'Player','Club']]
df
Reset Index
This step is needed because I wanted to insert their nationality based on their index.
df.reset_index(drop=True, inplace=True)
Create a function to insert nationality of each players
I created this function that will have 3 arguments (a,b,c) a = Start of index, b = End of Index, c = Nationality inserted.
def nat(a,b,c):
df.loc[a:b,'Nationality'] = c
Inseting their Nationality
How it works is we simply insert the 3 arguments there and the function will locate the data with .loc[] method and index it with a,b arguments, and then it will insert the c argument(Nationality) to 'Nationality' Column. from the display(df) we can see that the Index and 'No.' Column that can help us see at what rows/index is the next countries for a and b arguments.
nat(0,25,'Ecuador')
nat(26,51,'Netherlands')
nat(52,77,'Qatar')
nat(78,103,'Senegal')

nat(104,129,'England')
nat(130,154,'Iran')
nat(155,180,'United States')
nat(181,206,'Wales')

nat(207,232,'Argentina')
nat(233,258,'Mexico')
nat(259,284,'Poland')
nat(285,310,'Saudi Arabia')

nat(311,336,'Australia')
nat(337,362,'Denmark')
nat(363,388,'France')
nat(389,414,'Tunisia')

nat(415,440,'Costa Rica')
nat(441,466,'Germany')
nat(467,492,'Japan')
nat(493,518,'Spain')

nat(519,544,'Belgium')
nat(545,570,'Canada')
nat(571,596,'Croatia')
nat(597,622,'Morocco')

nat(623,648,'Brazil')
nat(649,674,'Cameroon')
nat(675,700,'Serbia')
nat(701,726,'Switzerland')

nat(727,752,'Ghana')
nat(753,778,'Portugal')
nat(779,804,'South Korea')
nat(805,830,'Uruguay')
Export the Dataframe to .csv
Export the dataframe to get the .csv file.
df.to_csv('wc_players_wiki.csv', index = False)
Chapter 2 - Data Wrangling
Data wrangling involves various operations to transform and prepare data for analysis, it is similar to data cleaning but Data wrangling is much broader task than cleaning, this includes combining datasets and adding values from different sources. In this project I will combine the two .csv we get from before and also adding some values from other sources to fill some of the players data. The result of this process is we will have one table contains all the world cup players without single player missing their values, so we can use it for analysis more accurately.
Load the Data to Excel
Load both .csv files we extracted from python before to Microsoft Excel. In Excel go to Data tab and click Get Data > From File > From text/CSV
INDEX + MATCH
Duplicate the wc_players_wiki sheet and rename it to wc_players_lookup. In this sheet we will fill all the Overall Rating and Age from the Data in fifa23_players_cleaned.
- FIrst step is to Find " (captain)" words in the sheet and replace it with "" to remove it.
- Create 2 new columns, named 'Age' and 'Overall'
- Formula for Age column =INDEX(fifa23_players_cleaned,MATCH(wc_players_lookup!$C13,fifa23_players_cleaned[Full Name],0),3)
- Formula for Overall column =INDEX(fifa23_players_cleaned,MATCH(wc_players_lookup!$C2,fifa23_players_cleaned[Full Name],0),4)
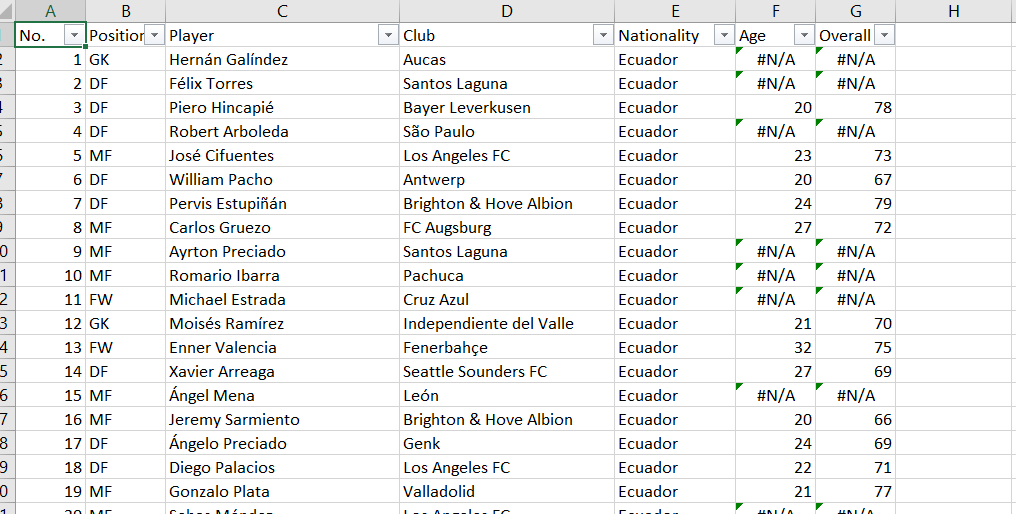
After this there will be some rows that are not filled or shown "N.A" value, that is because:
- The lookup value doesn't match. The solution is to use known_as column instead of full_name, because that's what happened in some countries like spain, portugal, or brazil the FIFA Data tend to use shorter name in known_as column.
- The name could be different, but they are the same person/player. The solution is to search the name in the FIFA Data manually with Find, and copy the name so it can use the index and match.
- The player just not exist in FIFA 23 game because not every player will be included in the game, especially for less popular country/club. The solution to go to fifaratings.com and search for the players, for the age just search the player in Google.
Create a master sheet
Create a new sheet and rename it to wc_players_master, and this sheet will contains all the Data we're going to use. Copy all the values from lookup Data and paste it to master sheet. and then, we can start the Data Entry process for filling all the missing values, by doing the solution mentioned before in point 3 above.
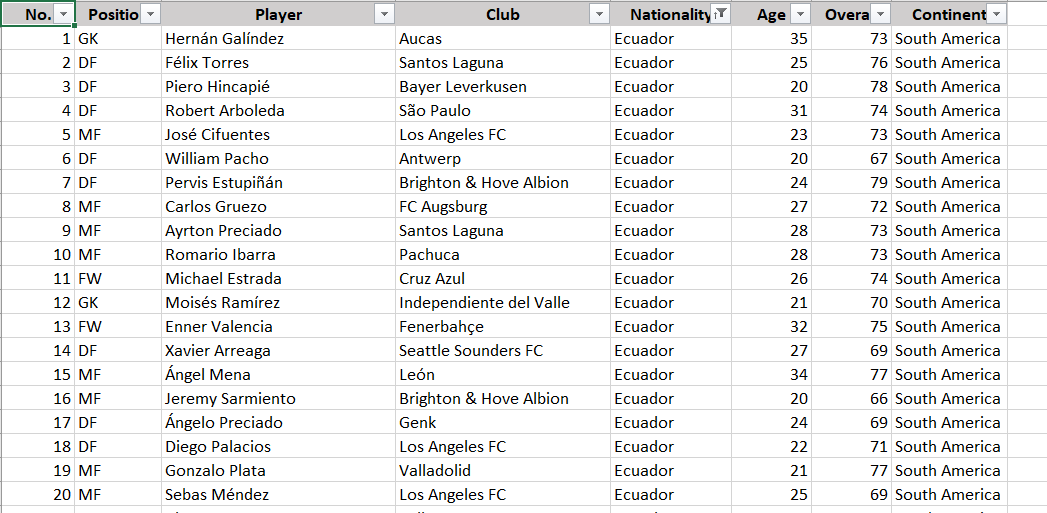
After all the players have their age and overall, we can save this workbook and export it for us to use in Tableau.
Chapter 3 - Tableau
In this Chapter we will visualize our data so we can see it more clearly. Imagine looking at thousands of rows of data and try to analyze it straight away, it will take an awful amount of time. So, one of the purpose of Data visualization is to made the analysis easier by looking at different charts and graphs that fit with the analysis. This will allow us to gather insights and explore the data more.
Load the Excel workbook
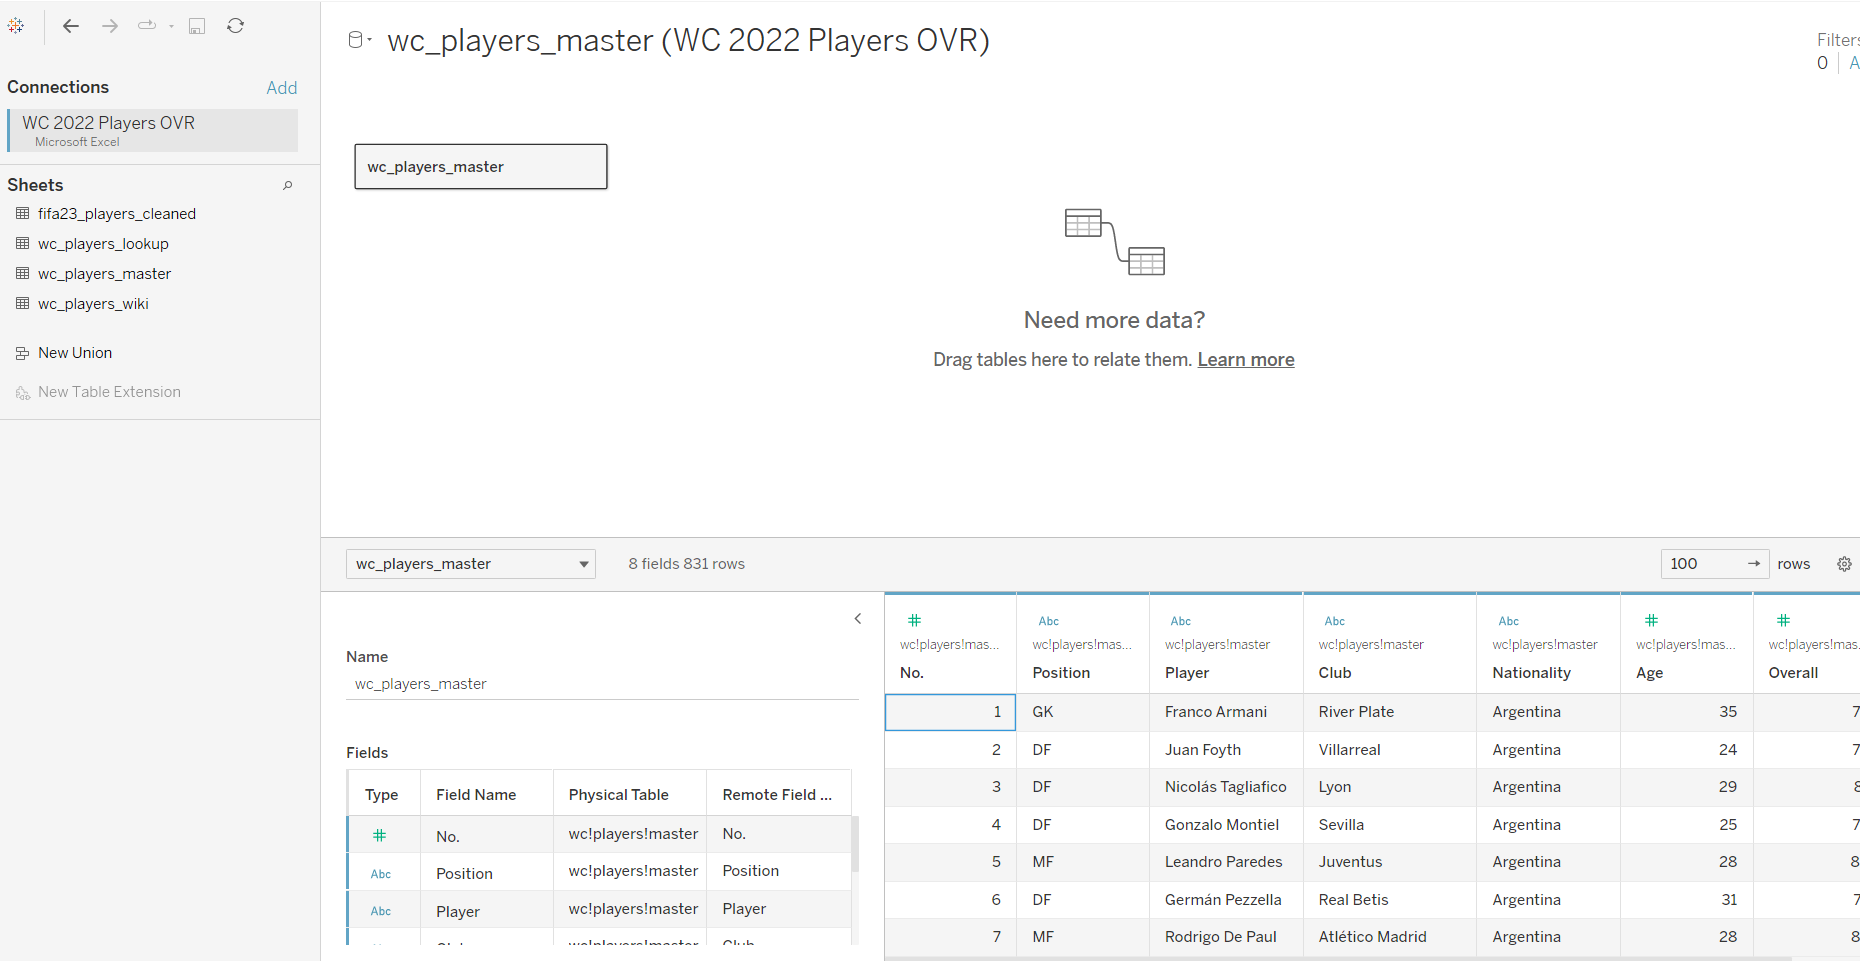
Load the excel workbook we created before, and choose the wc_players_master.
Overall Rating of all Countries
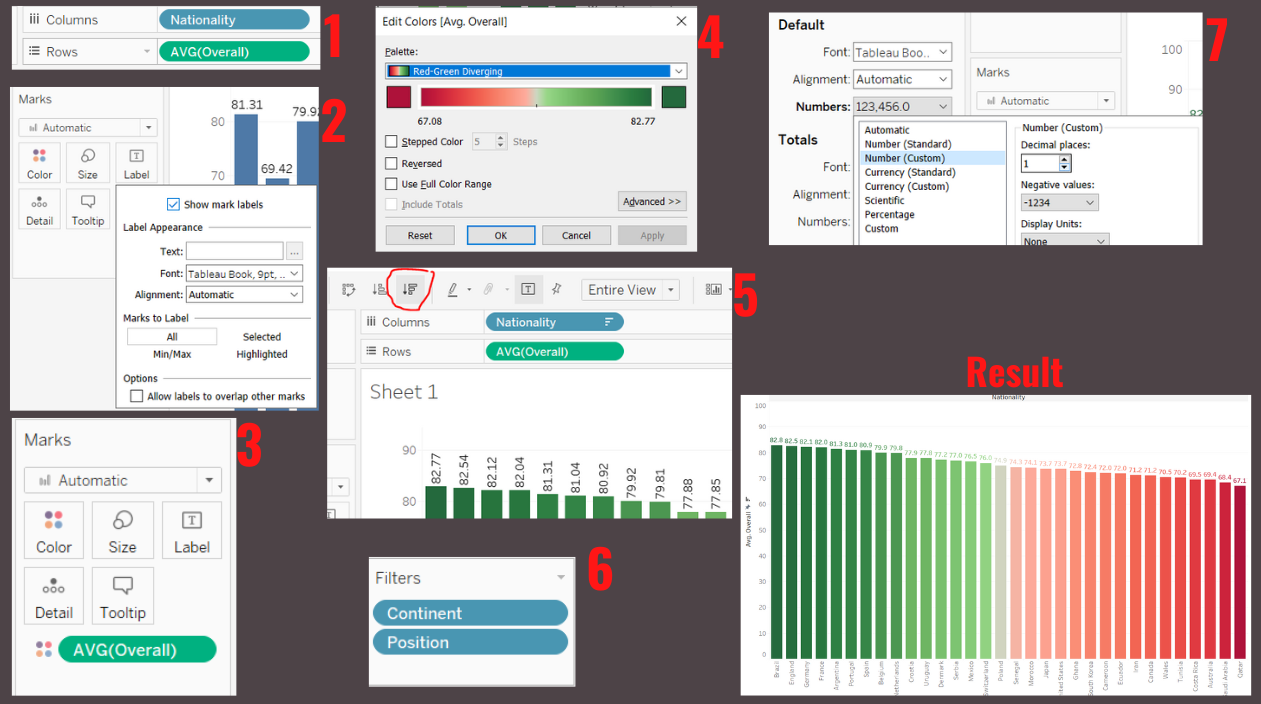
We're going to make Bar chart that can show all the Countries Overall Rating with conditional formating.
- Put the Nationality in Columns and Overall in Rows, and change the measure of Overall from SUM to Average.
- Click Label in Marks and check the Show Mark Button to show the number above the bar chart.
- Drag Average Overall to Color so we can Color Format it.
- Click color in Marks and Edit Color, and change it to Red-Green Diverging
- Sort the Chart from highest to lowest(Descending).
- Add Continent and Position to Filters, to use it later in dashboard as a filter.
- Right click on the AVG(Overall) and Change the Format of the numbers to Number (Custom), change it to 1 Decimal.
Age of all countries
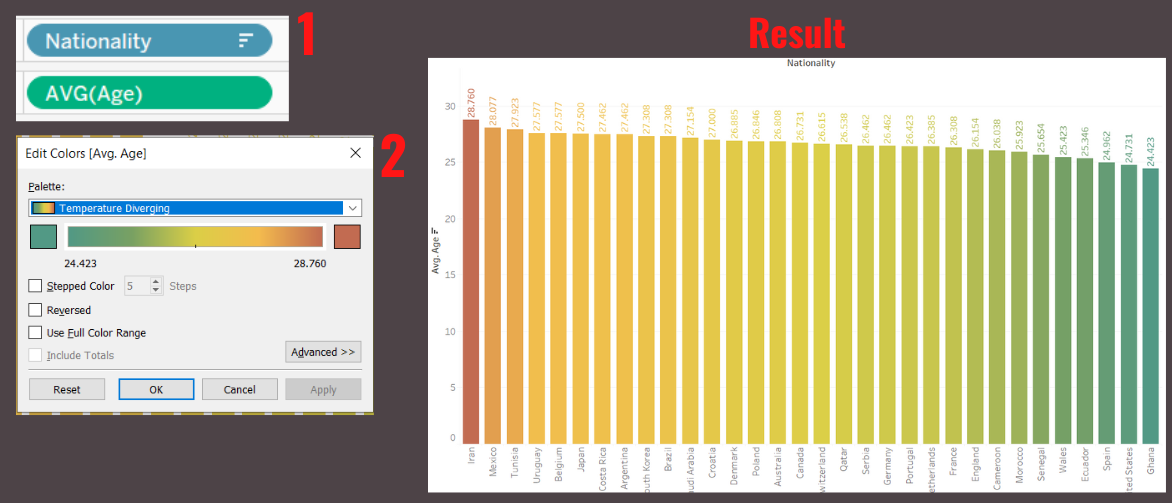
For age bar chart we just need to duplicate the sheet before and make a little bit of change.
- Remove the AVG(Overall) and replace it wih AVG(Age).
- Change the color of the bar, the lowest will be green and the highest will be brown (Because green match with young and brown match with old just like a plant).
Highest and Lowest overall
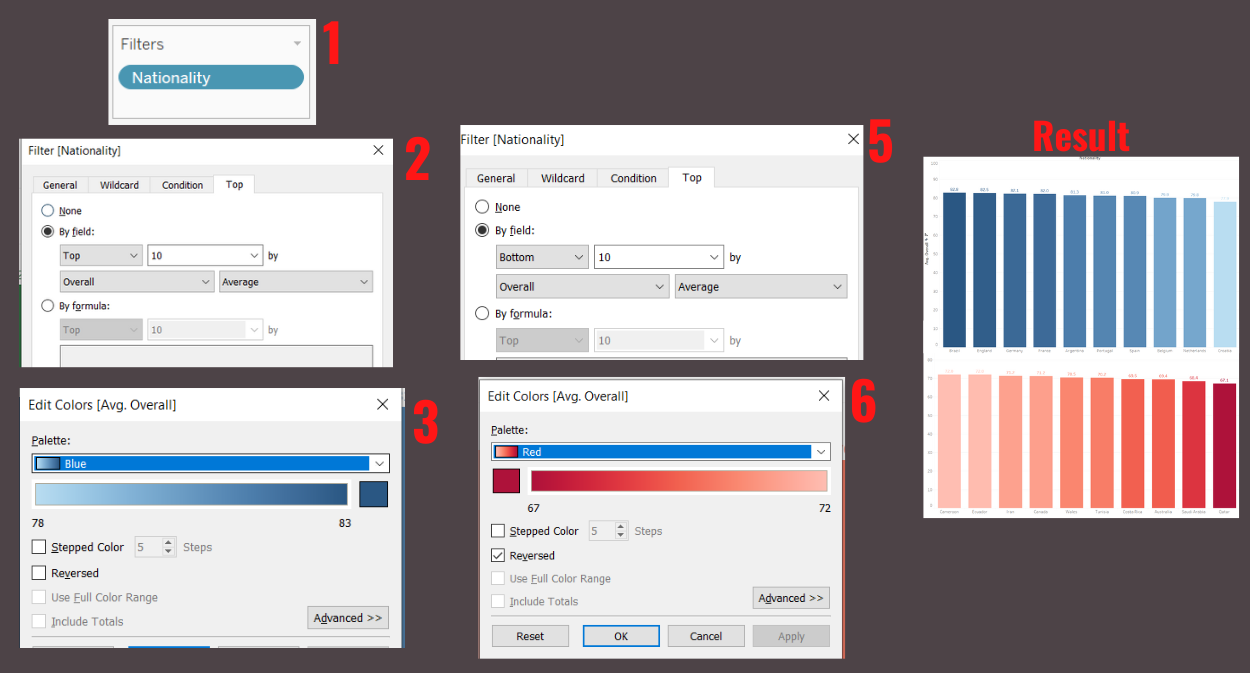
For Highest and Lowest chart we will duplicate it just like before.
- Put Nationality to Filter to use a filter.
- Change the filter setting to Top > By field > Top 10 by Overall Average.
- Change the color to dark blue for highest and light blue for lowest.
- For the Lowest duplicate the Highest sheet and just change the filter from Top 10 to Bottom 10.
- Change the color to dark red for Lowest and light red for highest.
Creating the Dashboard
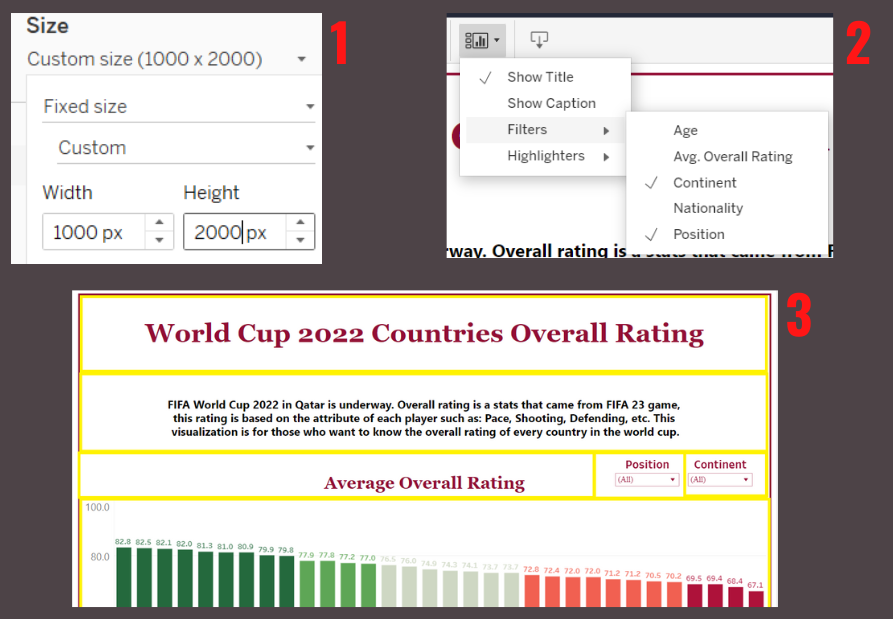
The dashboard will be the main display that will contains all of the visualization before.
- Set the size of the Dashboard to Fixed Size Custom 1000 x 2000 pixels
- To add a filter, first add the first sheet which is overall rating bar chart to the dashboard and then click the sheet, after that the Show Cards icon will be able to be clicked. Choose Filters > Continent & Position.
- in the third image I create yellow lines to show different elements in the dashboard, such as Text Box to show text that are seperated from the visualization sheet before, filters, and also the sheet of visualization we created before.
- The rest of Dashboard making process is quite easy, we just need to drag the sheet we created before (it's on the left side of the dashboard sheet) and then adjust the size.
Chapter 4 - Result
Dashboard
This is the Dashboard that I created, you can filter the data based on position/continent and also hover over the data to show the detailed info (tooltip).

Insights
- Brazil has the highest overall rating of all countries.
- Qatar has the lowest overall rating of all countries.
- Netherlands and England has the best DF (Defender) Overall Rating, that means this two teams has the best collection of defensive players.
- Germany has the highest MF (Midfielder) Overall Rating, that means Germany has the best collection of midfield players.
- Argentina has the best FW (Forward) Overall Rating, that means Argentina has the best collection of attacking players.
- Iran has the oldest set of players(28.8 Average), while Ghana has the youngest set of players(24.4 Average).
Conclusion
After finishing this Project, all my questions before has been answered. I came to conlusion that the Top 10 teams is the teams that are always be the favorite team that people choose/support to win the World cup.
These teams definitely has higher chance getting to knockout stages or even become the champion because because there are simple reason behind it:
Brazil won WC 5 times, England always goes through knockout stage and have really good players, Germany won WC 4 times, France just won it last WC in 2018, Argentina has 4, Portugal have Cristiano Ronaldo the GOAT, Spain won it in 2010, Belgium is Rank 1 in FIFA ranking, Netherlands reach 3 WC final, Croatia lost final to France in 2018 final.
The exposure they had to top level football, the top players they had, and the popularity is what makes them different. So it totally make sense that one of these teams going to win it, I am 80% sure.
But in the end, the ball is round, you'll never know what will happen on the pitch, we might see some surprise like underdog team beating the favorite team, or even proceed to knockout stage and finals, and That's Football.
Update 20 December 2022: See? Argentina won the World Cup, France is the finalist, Croatia is semi-finalist, and we have the underdog Morocco as semi-finalist.